This setting is used to control the data to be shown for a project respectively
the amount of data to be imported via API connectors.
Define the start date and/or the end date of the project. Start and end date can be set independently from each other.
Data with a report date outside the configured project time frame is ignored.
Configured milestones with a due date after the project end date are not
visible.
If no start and no end date is configured, all available data will be imported
from a data location.
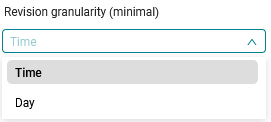
If you want to see more detailed revisions, to view each time new data is imported into MQC,
the Time revision granularity provides this option. This however results in more computation in the DataFlow
and a larger size of the project.
Figure 4.31 The default revision granularity is Days, but it might be useful to change it to Time for more details.
If an MQC project is shared between areas with different locales,
the calendar locale, which was initially determined during the creation
of the project, is kept. This allows a consistent view on data and quality.
Per default the usage of Context Categories is disabled, hence, all data is
expected and shown for all artifacts. To apply the context category configuration,
enable this setting.
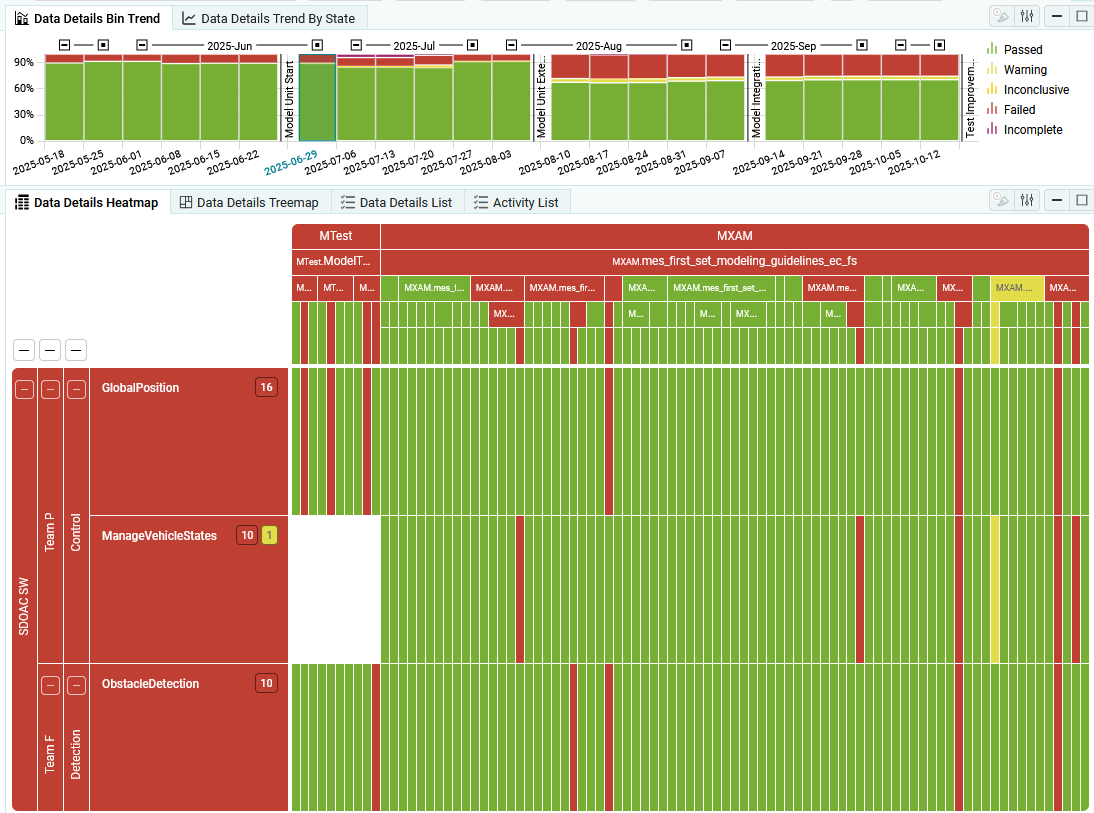
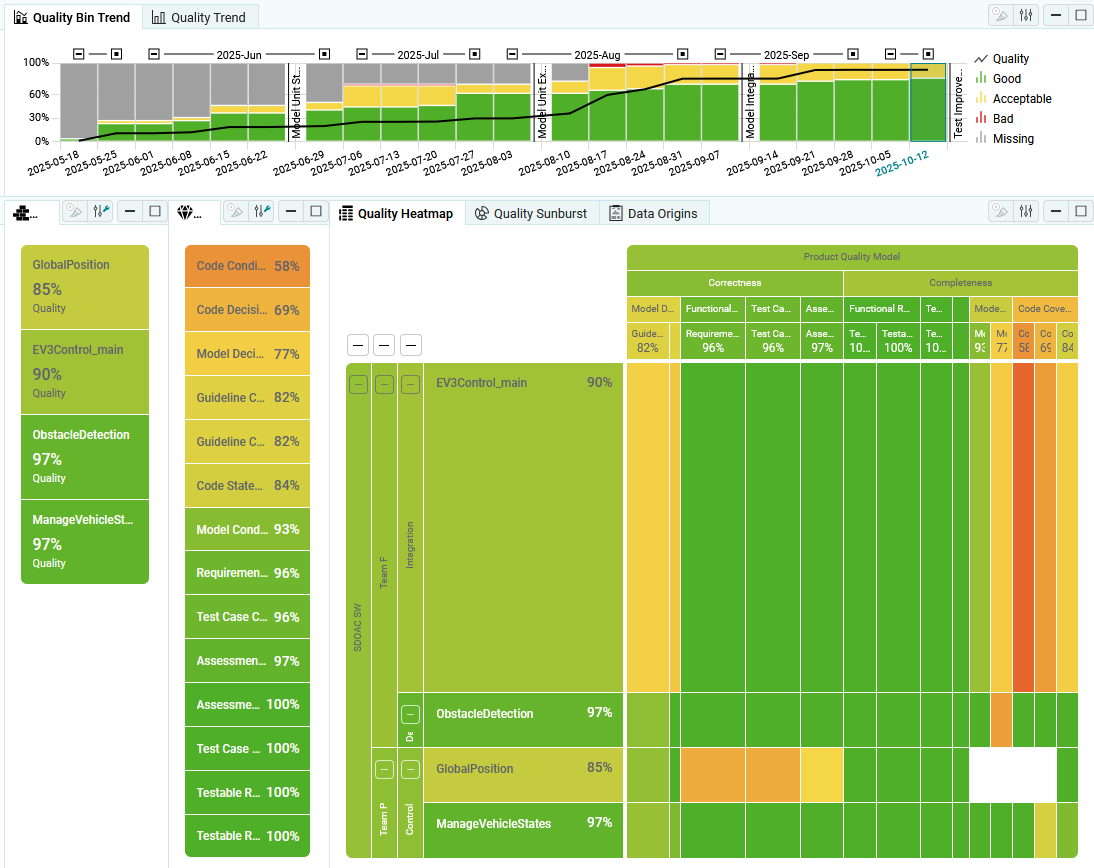
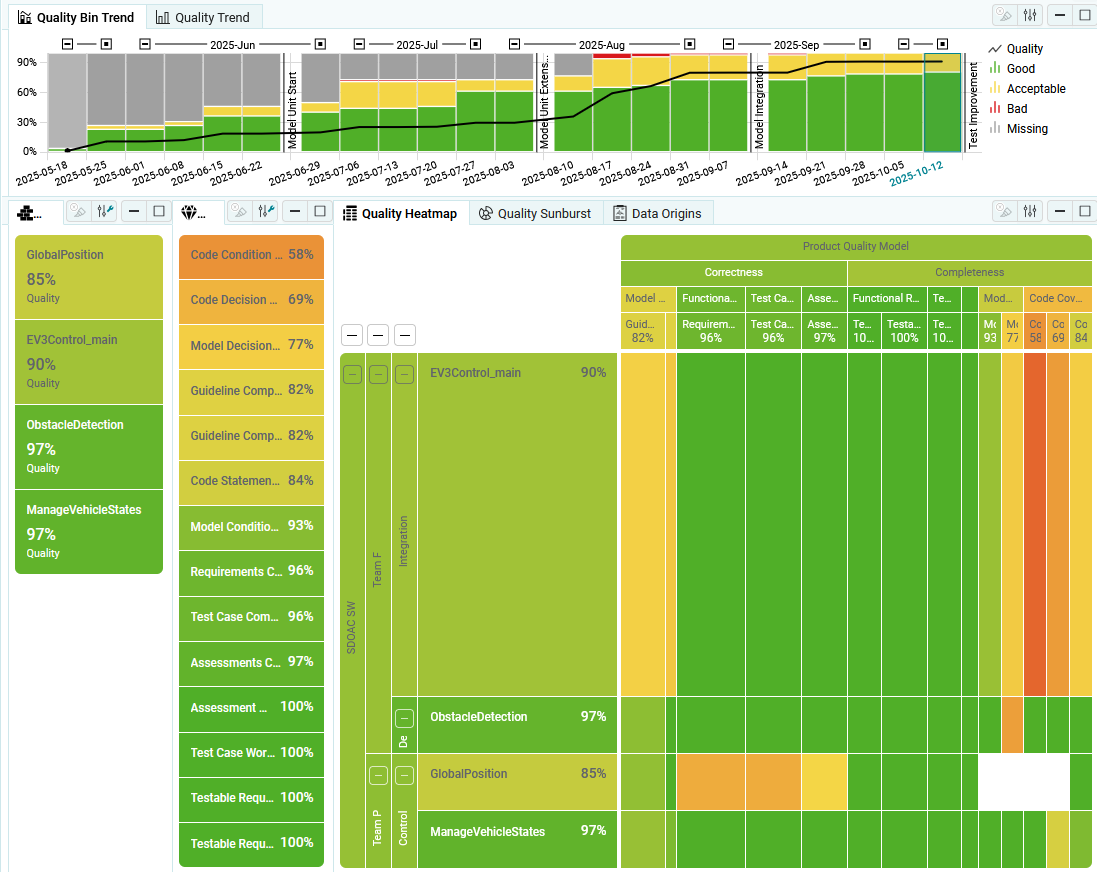
With context categories enabled, for each artifact only expected data is shown
in all visualizations (see Figure 4.33).
All other data is excluded (white areas of the matrix). By this, you can easily
distinguish between not expected data and data that is really missing.
(see context categories in Artifacts)
Figure 4.33 Availability Heatmap showing expected data (Context Categories enabled).
Additionally, only expected data is used for calculating quality for an artifact.
By default, MQC monitors all configured data locations for changes. The interval
for the checks is set to 10 seconds. The next interval only starts after the
current check has been completed.
Figure 4.34 Enable/disable the monitoring of the Data Locations
and change the monitoring interval
If a change in a data location is detected, either the user is notified about
the change or an automatic update of the imported data is triggered (see
client-side automatic data refresh in Keep the project up to date).
To disable the monitoring, deselect the option.
Apart from that, the monitoring interval can also be adjusted. This is
particularly useful if several data locations with large amounts of data contained
are configured, where a check for updates would take longer than the configured
interval.
MQC projects with this setting enabled and saved in the server library are
updated periodically to fetch the latest data changes.
Background server-side updates are only executed if new or changed data was detected.
This ensures that all relevant projects are always kept up to date.
See Update Projects (and export scheduled) for details on how to add a job to the
“Automation Services” on the MQC Server to periodically check and update
MQC projects.
by a client-side automatic data refresh
MQC projects open in the desktop client and web player use a background monitoring to detect changes in the data
of the projects.
While this setting is disabled, the user is informed of updates by a change in the
Refresh Button and Data Import State. The user can then update the project by clicking on the “Refresh Data” button
provided there.
While this setting is enabled, any change detected in the data results in a directly executed update of the
project in the client, while the user is interrupted in his work and has to wait until the project has been updated.
If Data Details are not disabled, they are imported by the DataSource adapters that can read findings.
Disabled
Data Details are disabled.
The DataSource Adapters do not import findings.
The Data Details page and Data Details visualizations are not available.
On Demand
Data Details will not be imported by default, but can be loaded on demand later.
The Data Details visualizations show ‘Not Loaded’ findings, while the List shows
a warning message, if data details have not been imported.
By clicking on the Configure Import button, the data details
to be imported can be configured with the combination of artifacts, datasources
and revisions.
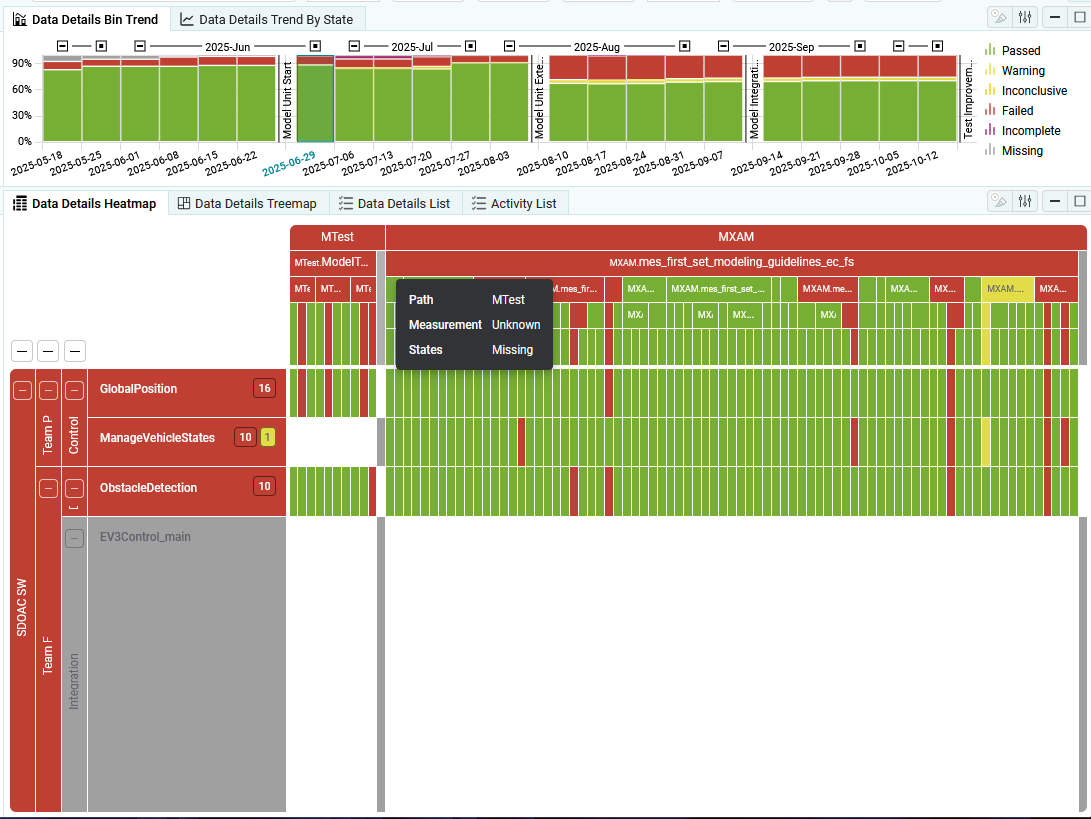
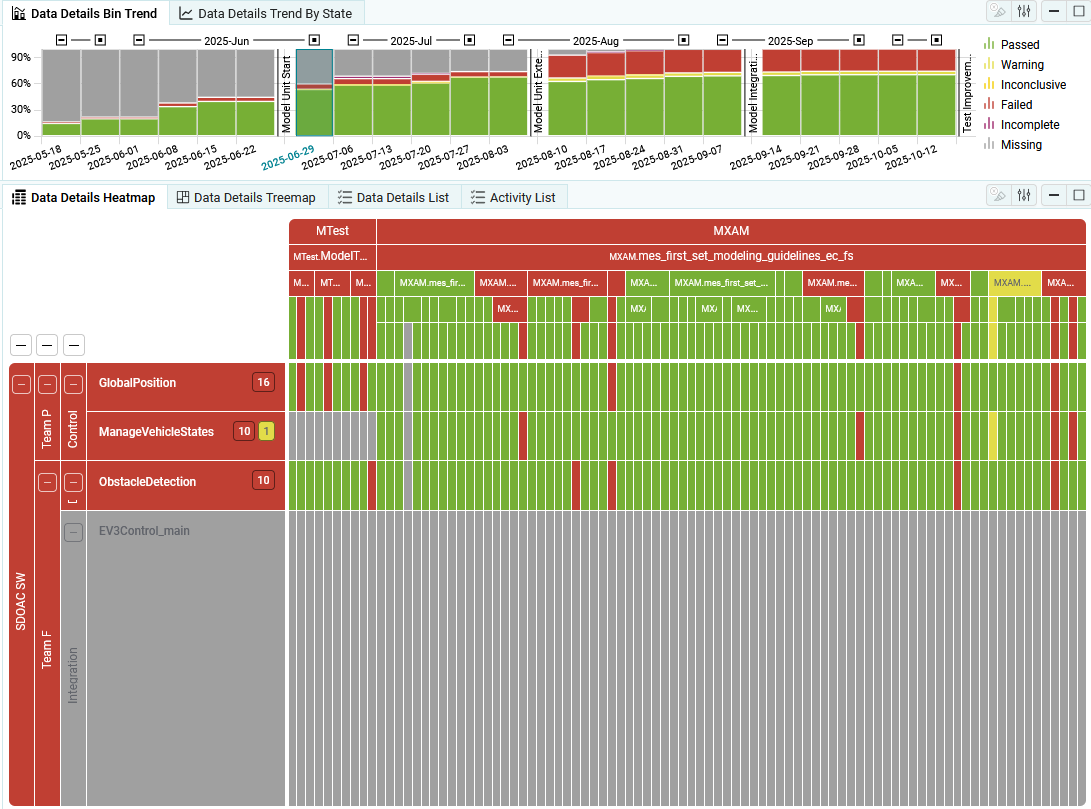
Missing findings are created and shown per Data Source.
Because it is unknown which Finding Structure a missing finding might have,
the finding structure is shown as “Unknown” in the Heatmap, Treemap and Structure Visualizations.
Figure 4.38 Data Details with Missing per Data Source
per Finding Structure
Missing findings are created and shown per Finding Structure.
For each finding structure path and artifact, at least one finding is expected.
Therefore, a missing finding is created per artifact and finding structure path, if
no finding was imported for that artifact and that finding structure path.
Warning: This option might impact the performance negatively, esp. for large project and some data sources.
Figure 4.39 Data Details with Missing per Finding Structure
By checking “Show all data details for the selected date range”, the data details are no longer shown for the selected
revision and the revision selection is no longer part of the data details page.
All data detail visualizations show all findings in the currently selected date range, everything by default.
This setting is useful if the data was configured as incremental and the findings are
therefore also only imported incrementally.